Quiz
statistics provide vital information for data analysis. Quiz statistics
contains all pertinent information on the quiz so that you can evaluate the
data. This tutorial demonstrates how to view quiz statistics in MyFIRE.
Note:
The method of calculating standard deviation from the sample standard deviation
is the population standard deviation.
1. Locate
and access the desired course in MyFIRE.
2. Select
the instructor tools tab at the top of the page in the navigation bar.

3. A
drop-down menu will appear. Select course admin.

4. When
the page refreshes, locate and select quizzes.

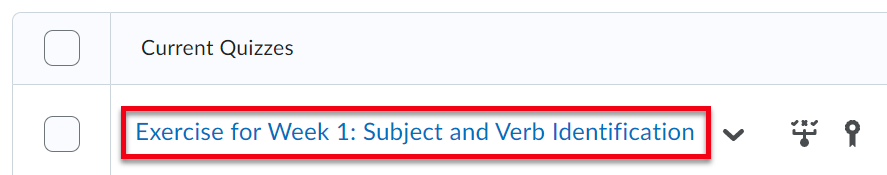
5. When
the page refreshes again, a list of all of the quizzes that have been created
in the course will appear. Locate the desired quiz.
6. Select
the drop-down arrow to the right of the quiz title.

7. A
drop-down menu will appear. Select statistics.

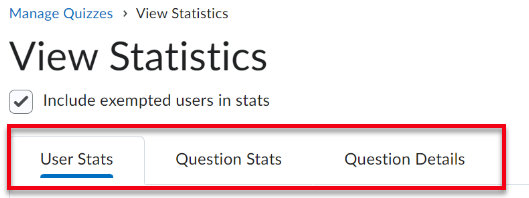
8. When
the page refreshes, the statistics view of the quiz will appear with three
different views:
a. User Stats- User Stats contain (A)
performance data by user, (B) students’ names, (C) the users’
scores, the (D) class average, and (E) the standard
deviation.

i. Grade Distribution
Performance Data graph legend:
1. Bar Height- How many students
receive the specific score
2. Bar Width- Shows the range of
scores
3. Large Solid Squares- Represents 25%
4. Small Lighter Squares- Represents 5%
ii. If you need to find out
if a student has attempted the quiz, enter the student’s name in the search
bar.

iii. Select the magnifying
glass icon. Note: If the student has attempted the quiz, the
student’s name will appear. If the student has not attempted the quiz, the
student will not appear on the user stats page.

b. Question Stats- Question Stats
contain data about the (A) average score on questions by percentage, (B)
standard deviation, (C) discrimination index, and (D) point
biserial per question.

i. Average Grade- The type of question
(e.g., an out-of-the-book question, a basic application question, or an
advanced problem-solving question) will determine what the overall goal
percentage will be for each question. The goal percentage is determined by the
instructor’s discretion. An example percentage goal for questions is:
1. 100% for
out-of-the-book questions
2. 70-80% for basic
application questions
3. 30-40% for advanced
problem-solving questions.
ii. Standard Deviation- Shows the range of
scores. The method of calculating standard deviation is the population standard
deviation.
1. High Number- This means there was
a wide range of responses where students have different answers. Questions with
a high number of incorrect answers will have a high deviation because students
were unsure about which answer selection was correct.
2. Low Number- Students answered in
the same way. Questions with a high number of correct answers will have a low
deviation.
3. N/A- The data will not be
able to calculate if the question type is a short answer question, a written
response question, part of a question pool, or if the scores have not been
published.
iii. Discrimination Index- This data is
calculated by the top performing group (e.g., top 27%) minus the bottom
performing group (e.g., bottom 27%) of the population’s total scores.
1. When the top group of
students answers the questions correctly, and the bottom group does not answer
the question correctly, the data will show that the question is able to
separate the two groups of students. (large # - small # = a large # = a high
discrimination index)
2. When both sets of
students answer the question correctly, there is no difference (high # - high #
= a low # or 0 = a low discrimination index)
3. If a negative
discrimination index appears, this means that the low-scoring students have
gotten the question right and the top scoring students have gotten the question
wrong. This means that something is wrong with the question and the question
should be revised.
iv. Point Biserial- Uses a complex
equation to show if the question fits the pattern of the rest of the quiz/exam,
including showing how difficult a problem is for students. Scores will range
from 0 to 1.
1. Positive Number- This means that the
students are getting the question right.
a. A high positive number
demonstrates that only the best students answered the question correctly
b. If the positive number
is too high, the question may be too difficult.
i. Above .3 = a good
challenge question
ii. Below .3 = good for
more basic question:
c. Negative Number- This means that only
the bottom performing students are getting the question correct. The question
should be considered for revision.
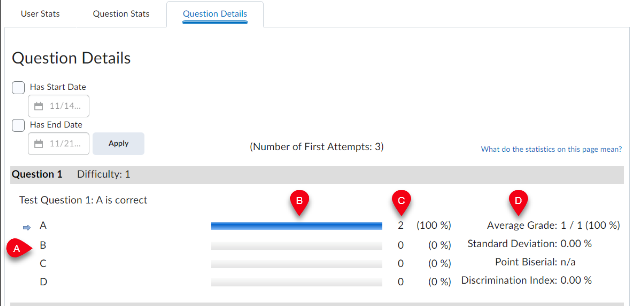
Question
Details- Question Details contain detailed information about each question in the
quiz, including (A) a list of all of the answers provided for each quiz
attempt, (B) how many users chose each possible answer, (C) the
total number of responses, and (D) the average score on the question.
Question Details reports can help you evaluate trends in the answers and
difficulty level for each question.