
Surveys
are an excellent way to solicit feedback from participants regarding aspects of
a course. For example, the survey tool could be used as a method of researching
additional information or prep for an in-class discussion. Once a survey has
been completed by users, instructors can view the results of the survey by
accessing the survey statistics. This tutorial demonstrates how to access the
survey statistics.
1. Locate
the desired course in MyFIRE that contains the survey
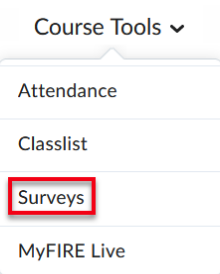
2. From
the navigation bar, select course tools.
3. A
drop-down menu will appear. Select surveys.
4. The
page will refresh to show the survey(s) that have been created in the course.
Locate the desired survey.
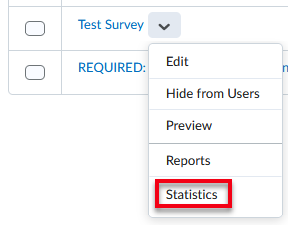
5. Select
the drop-down arrow to the right of the survey title.

6. Another
drop-down menu will appear. Select statistics.
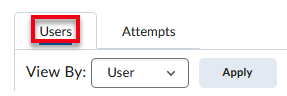
7. When
the page refreshes, a list of the users who have taken the survey will appear
on the Users tab. On this page, instructors can:
a. Search for the users by
name.

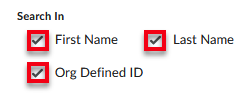
b. If additional search
options are hidden, select show search options.

i. Additional search
options include:
ii. Option to Narrow Search
field by: first name, last name, or by org defined ID (student ID number).
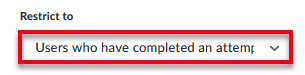
iii. Filter the user list
under the restrict to title by: All Users, Users who have not taken an
attempt, Users who have completed an attempt, and Users with attempts in
progress.
c. View the users’
attempt(s) and completion summary.
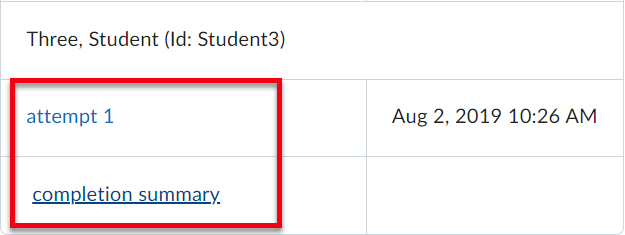
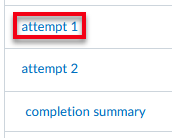
i. To view the user’s
attempt(s), select the attempt 1 link in blue. For multiple attempts on
a survey, the page will list each attempt.
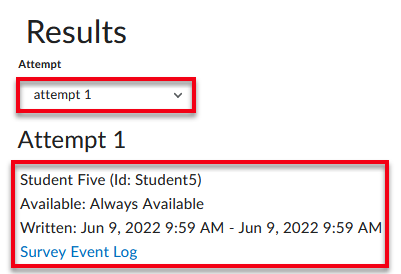
ii. When the page
refreshes, the instructor can view the student’s attempt (by the attempt
drop-down menu), name, ID, when the survey is available,
when the student has attempted the survey, and the survey event log for the attempt.
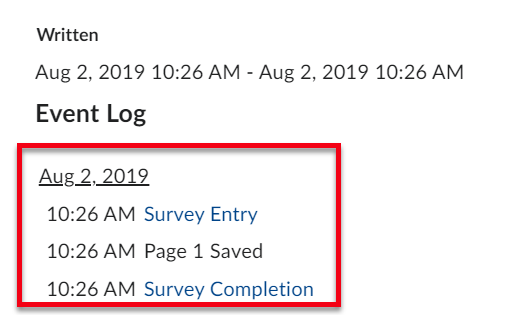
iii. Survey Event Log- When selected, a
pop-up window will appear that shows the date and timestamp of each movement by
the student in the survey.
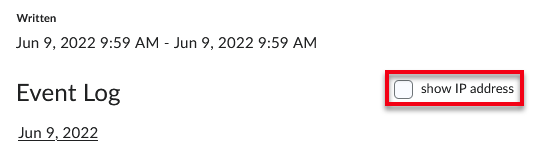
1. Instructors also have
the option to show the IP address of each movement by selecting the show IP
address checkbox.
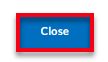
2. Once done reviewing the
event log, select close at the bottom of the pop-up window.
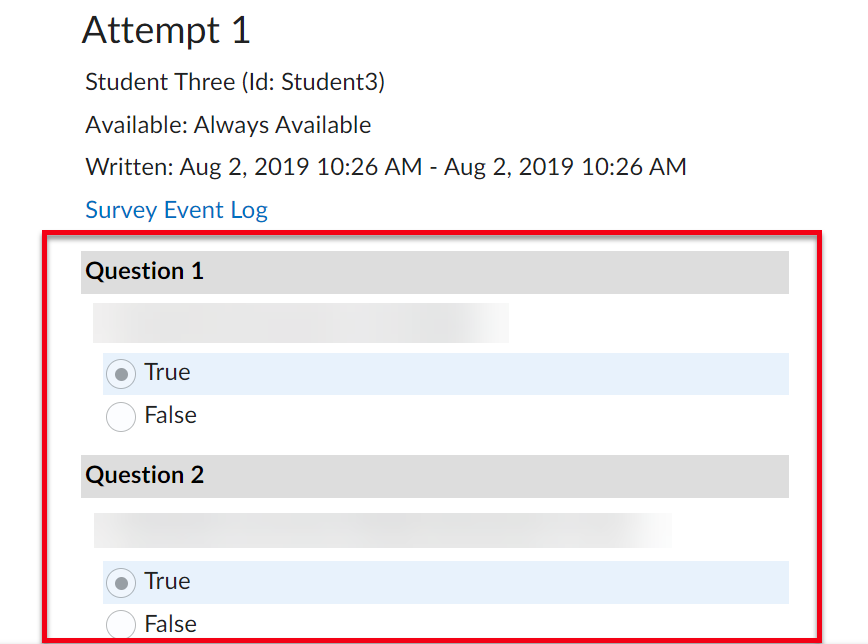
iv. Next, the instructor
can scroll down the individual attempt results page and review how the user
responded for each question in the survey.
v. Once done reviewing the
attempt, select close at the bottom of the page.
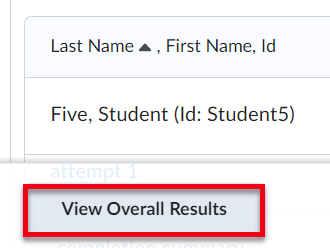
8. If
needing to calculate overall survey statistics for individual students (ex: if
utilizing the survey tool for peer reviews), select the view overall results button at the bottom of the page.
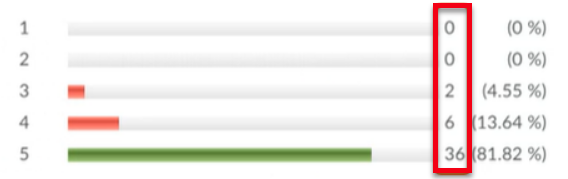
a. When the page
refreshes, the statistics will process and the results page will appear. Scroll
down the page to view the individual question results and corresponding percentages.

b. Use the following steps
to calculate the average percentage for each question for the single
student:
i. Convert the percentages
you wish to average into decimals: Turn the percentages into decimals by
dividing them by 100. This means that 4.55% is 0.0455 as a decimal and 81.82%
is 0.8182 as a decimal.
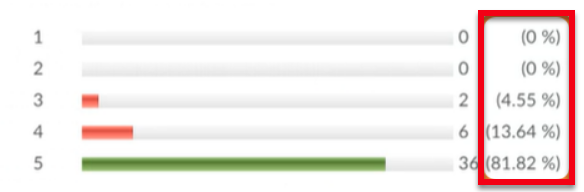
ii. Determine the number
that each decimal represents: Multiply the decimal by the total number
of selections for the corresponding answer choice. For example, 4.55%
represents 2 survey attempts. Therefore, 0.0455 x 2 = 0.091. Complete this step
for each answer choice in the question prompt.
iii. Add the numbers
together: Add
the numbers found in the last step together. So, 0 + 0 + 0.091 + 0.8184 +
29.4552 = 30.3646
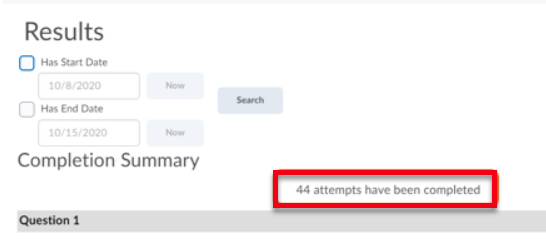
iv. Locate the sample size
(number of submissions):Add up the sample sizes for each percentage. Ex: 44
attempts.
v. Calculate the
percentage average: To
find the average percentage of the percentages, divide the sum of the
percentage numbers by the sum of the sample sizes. Ex: 30.3646 divided by 44
equals 0.6901.
c. Repeat steps 8.b.1. -
8.b.5.to find the average percentage for the individual student for each question
prompt on the survey.
d. Then add all of the
question prompt averages together to calculate the sum.
e. Next, divide the sum of the question averages by the number of questions in the survey.
f. Then multiply the
quotient (answer from the step above) by 100 to get the average percentage.
Ex: 0.6901 multiplied by 100 equals 69 or 69%. This means that the overall
average survey percentage for the example individual student is 69%
g. If needed, translate
the overall percentage to a points-based score by multiplying the
percentage by the maximum points available. For this example, the max point
value is 55. Therefore, 55 x .69 = 37.95 points for the individual student.