
The Class Progress tool provides a performance dashboard for
the instructor to use to monitor student performance in the course.
1. Navigate to your course in MyFIRE.
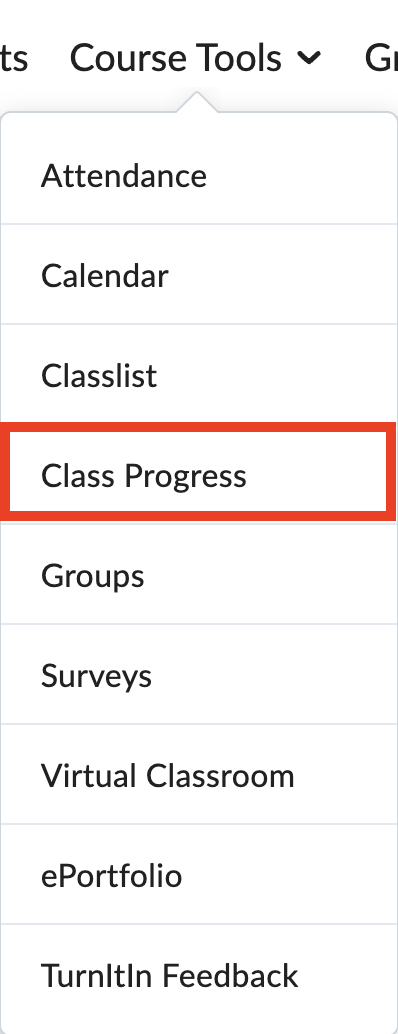
2. Select Course Tools in the navigation bar.
3. Select Class Progress.
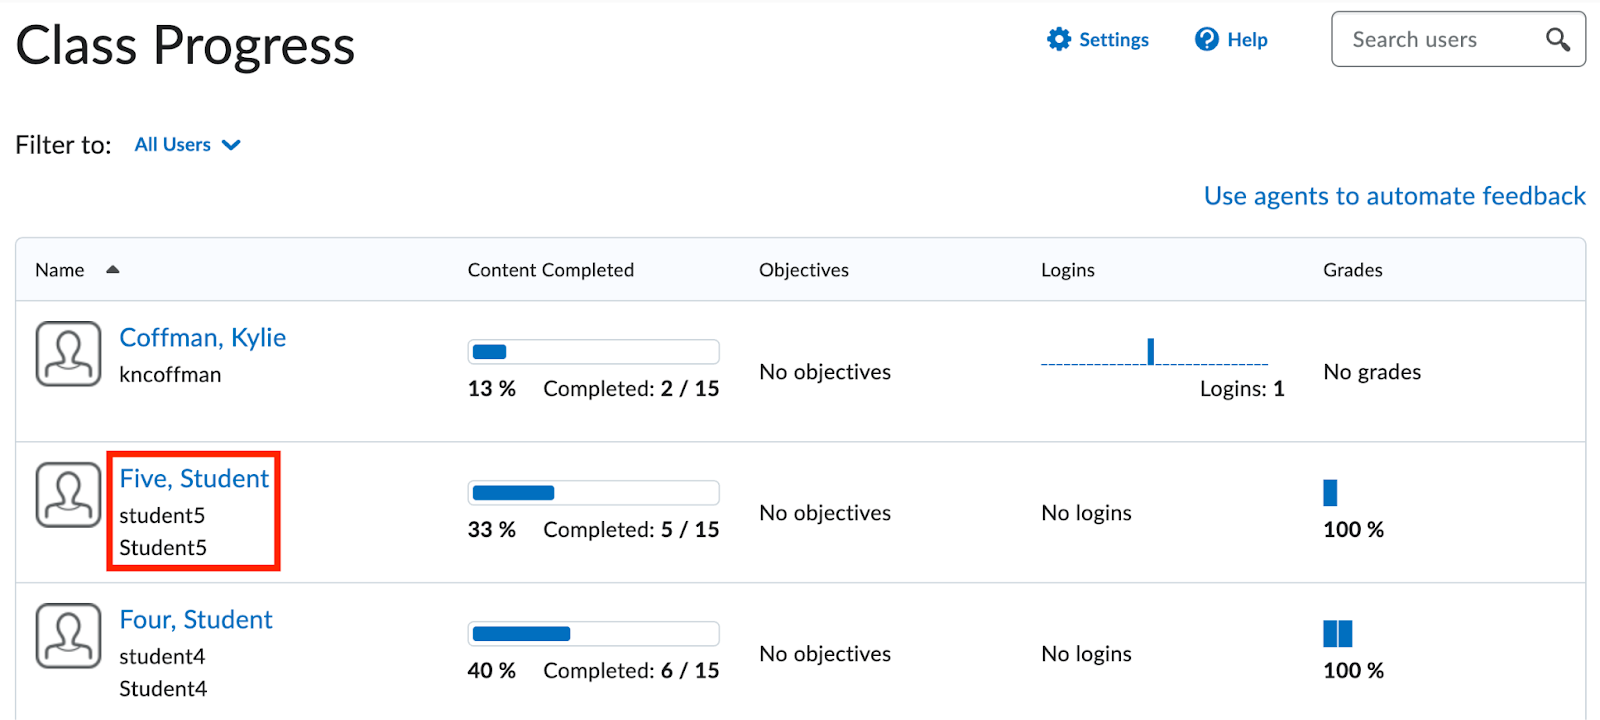
4. When the page refreshes, you will be able to see
a list of all the students in the course, including their username and ID
number.
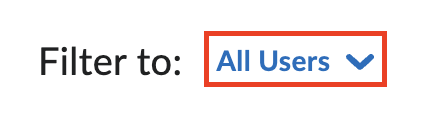
5. Select the Filter drop-down menu to filter the
list based on groups in the course.
6. Search for individual users in the search bar.
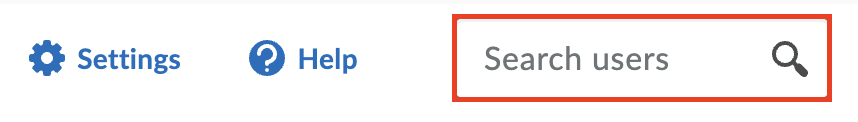
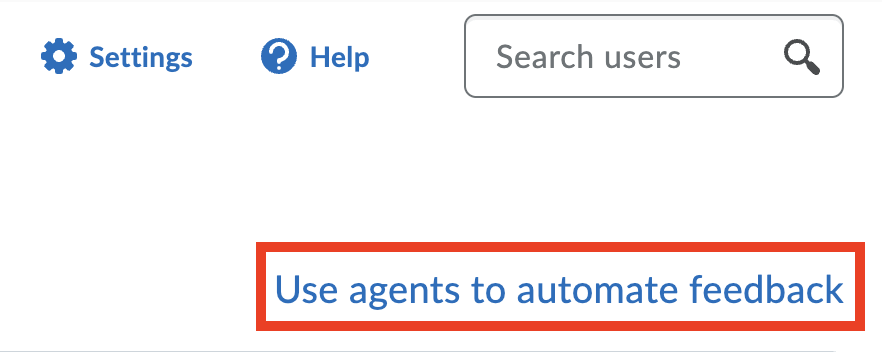
7. Select Use agents to automate feedback to be
taken to the Intelligent Agents page. View the Create an Intelligent Agent
tutorial for more information.
8. The default performance indicators available are Content Completed, Objectives, Logins, and Grades.
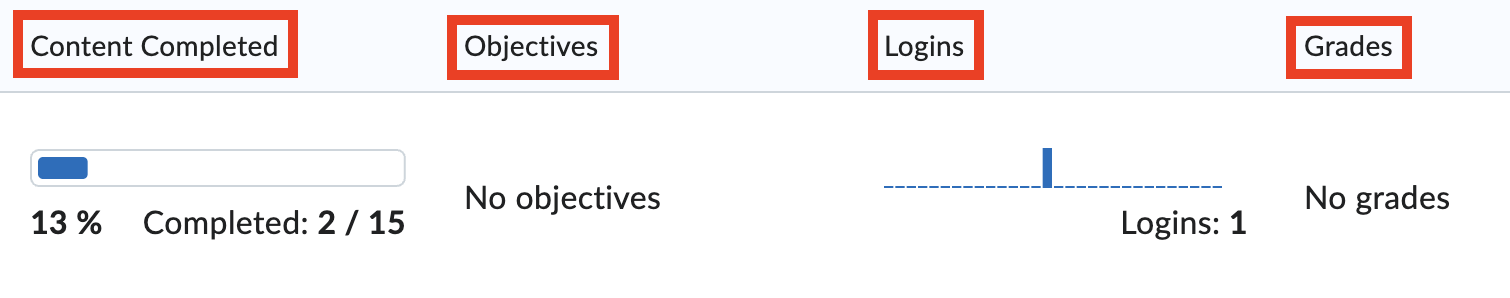
a. The Content Completion Summary indicator shows
how many required content topics each student has completed.
b. The Objectives Completion Summary indicator illustrates each student's progression through the assigned objectives.
c. The Login History indicator displays the number
of logins to the system for the last 30 days.
d. The Grades Performance Summary indicator presents the current final grade for the student, as well as a visualization of
the scores of the last 15 items. Hovering over each bar provides additional
details for the grades.
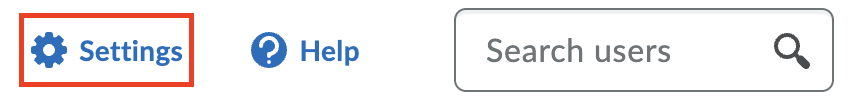
9. Instructors are able to view any four chosen
performance indicators from a selection of nine. To change which indicators you
would like displayed, select Settings.
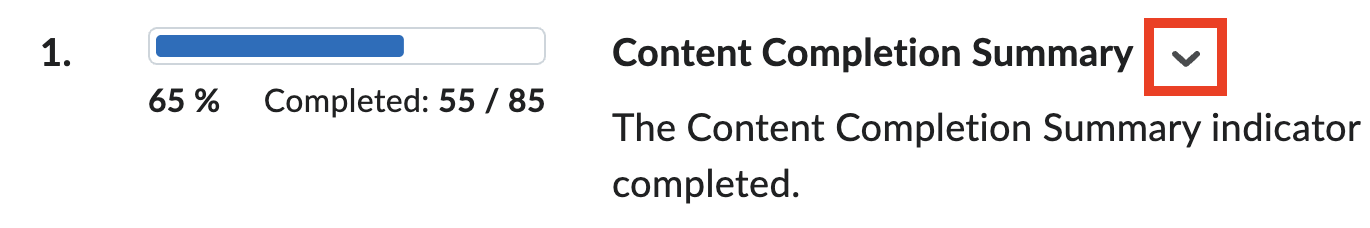
10. To
replace a performance indicator with another, select the drop-down arrow to the
right of the indicator title.
11. Select Replace.

12. A
complete list of indicators will appear. Select an option to replace the
current option on the list. The additional options are as follows:
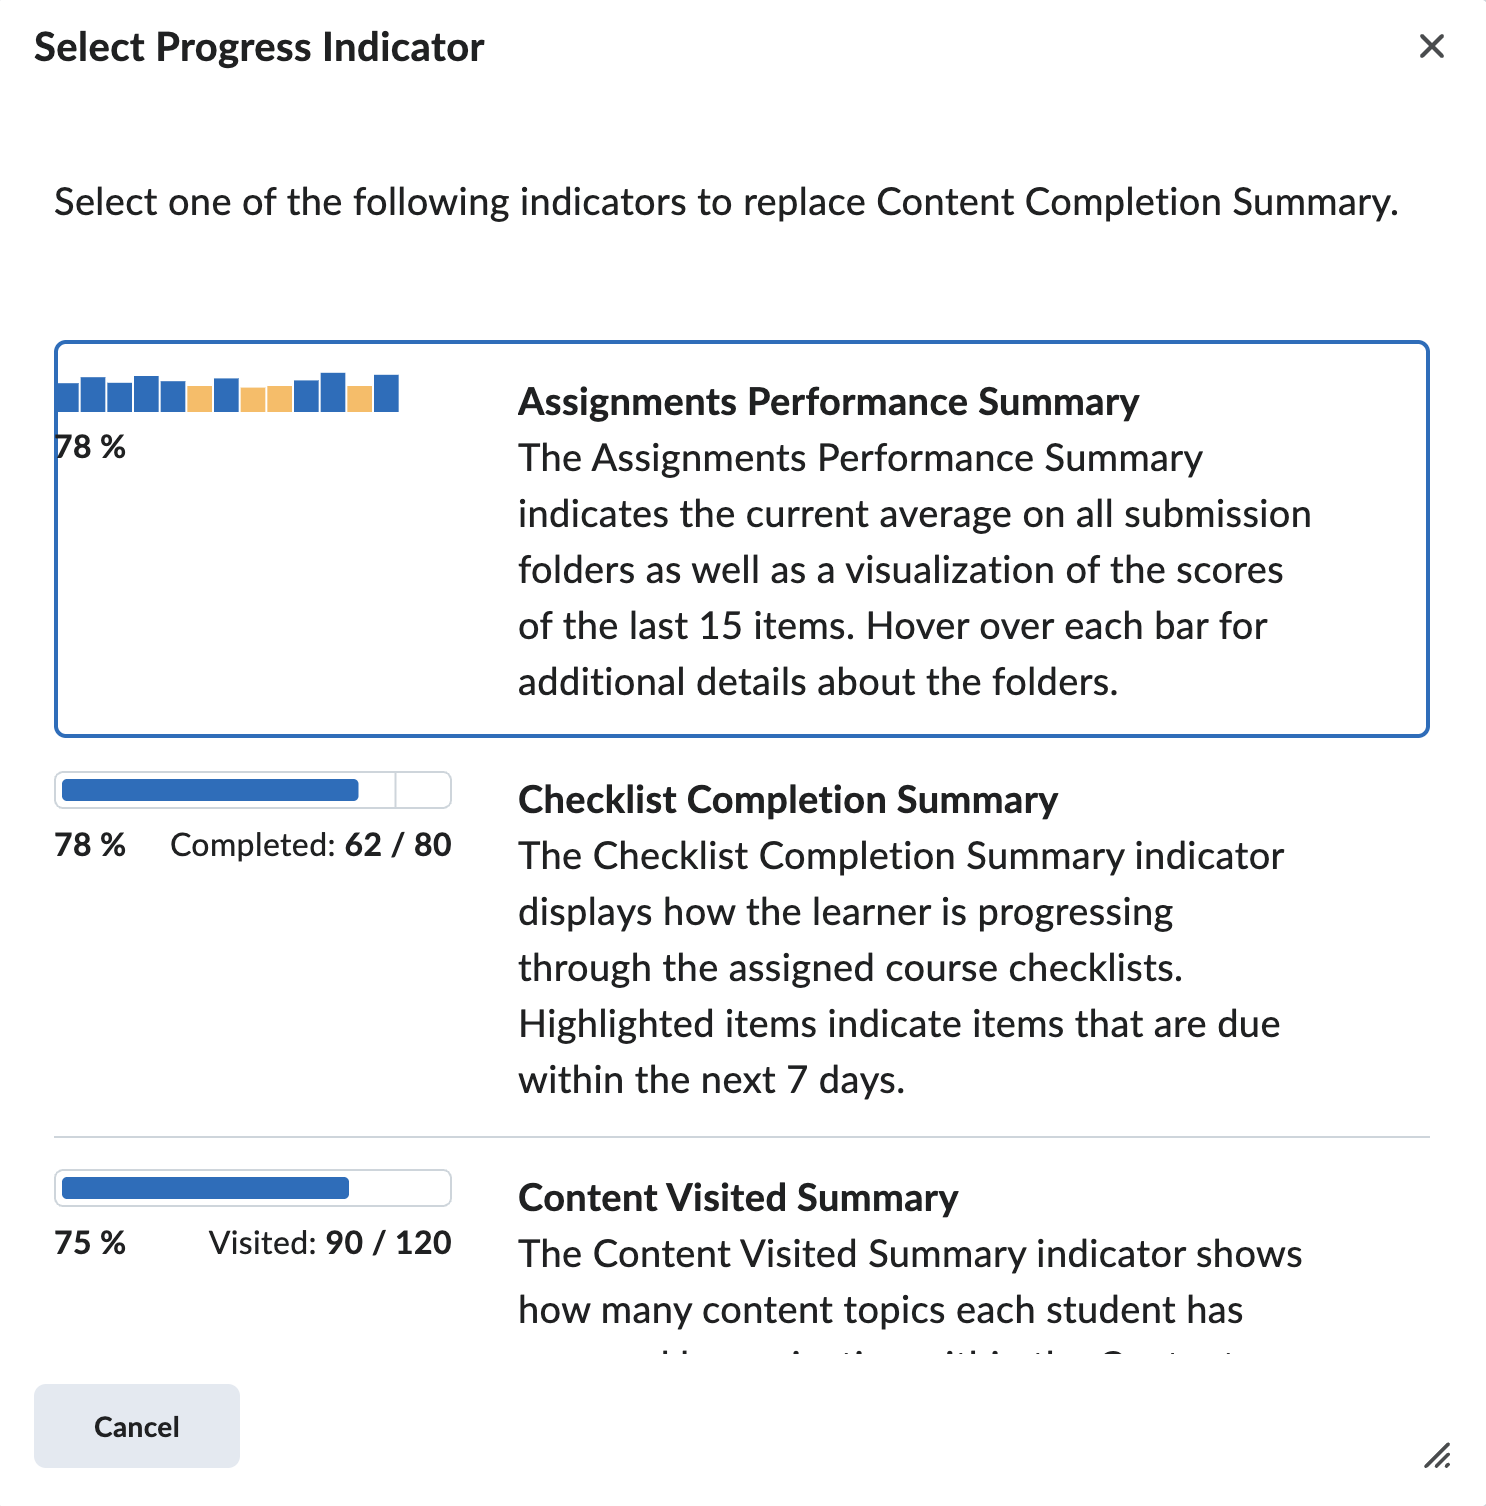
a. Assignments Performance Summary: Indicates the
current average on all submission folders as well as a visualization of the
scores of the last 15 items. Hover over each bar for additional details about
the folders.
b. Checklist Completion Summary: Displays how the
learner is progressing through the assigned course checklists. Highlighted
items indicate items that are due within the next 7 days.
c. Content Visited Summary: Shows how many content
topics each student has accessed by navigating within the Content tool. If
users navigate to an activity outside of the Content tool (for instance, by
using the navbar) it does not count as a visit.
d. Discussions Participation Summary: Presents user
statistics for reading, posting, and responding to discussions.
e. Quiz Performance Summary: Presents the current
average on all quizzes as well as a visualization of the scores of the last 15
items. Hovering over each bar provides additional details for the quiz.
f. Survey Completion Summary: Displays the
learner's progression through the assigned surveys in the course.
g. System Access: Displays the number of accesses
to the system for the last 30 days.
13. Once
finished selecting the performance indicators, select Save and Close to return
to the Class Progress page.
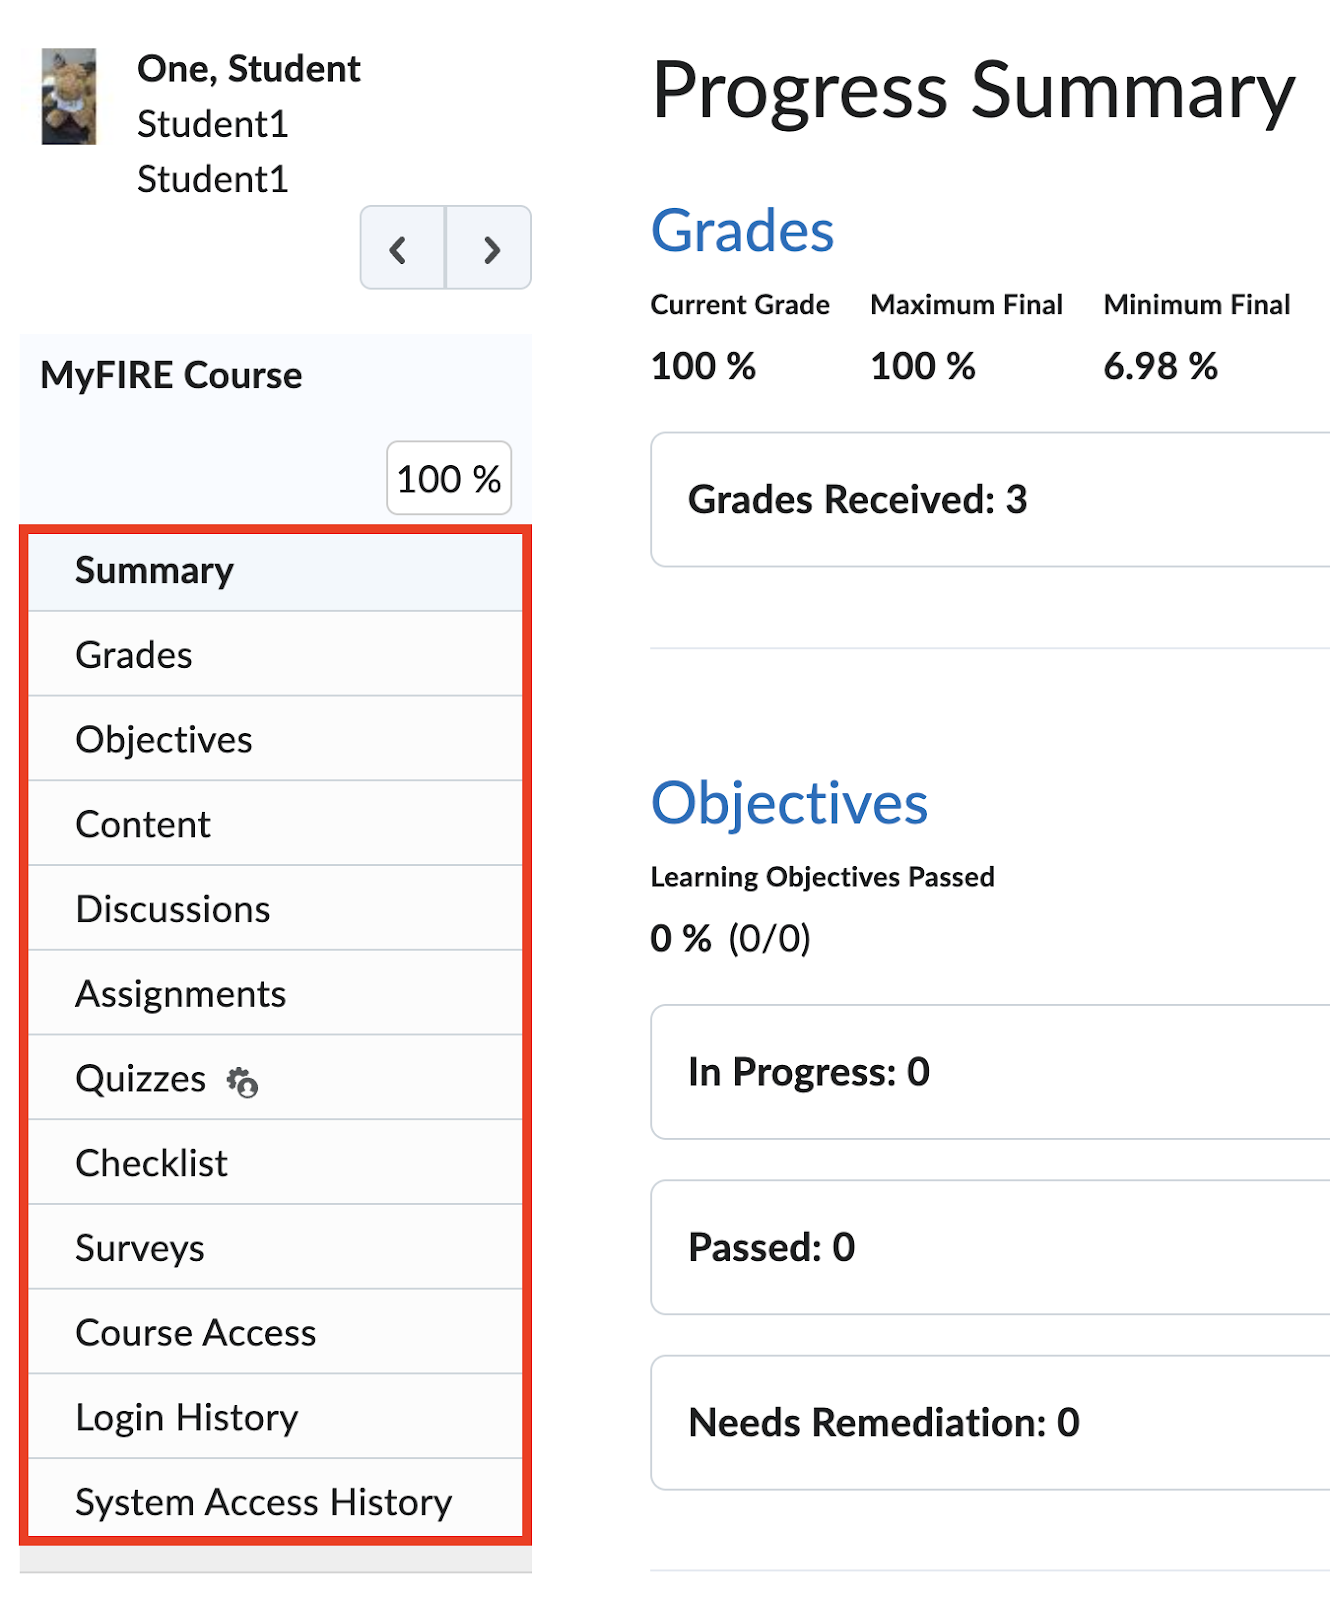
14. Select
the student’s name to be taken to the student’s individual progress page. From
this page, you can look further into the student's activity under the following
topics:
Note: The statistics will show in a
fraction format with the numerator representing the student’s actions within
the course, and the denominator representing the number of topics (assessments
and content items) available to the student in the course which can fluctuate
based upon course restrictions.
a. Summary
b. Grades
c. Objectives (if applicable)
d. Content
e. Discussions
f. Assignments
g. Quizzes
h. Checklist (if applicable)
i. Surveys (if applicable)
j. Course Access
k. Login History

15. On
the Class Progress page, select a performance indicator to view a detailed
report of the user's progress in that area.
